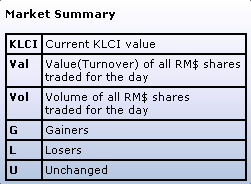
The Market Summary Toolbar gives the user a summary of the Market Performance. It shows
the current value and changes of the Kuala Lumpur Composite Index (KLCI), the total market
value and volume. The number of gainers, losers and unchanged counters for the trading day are
also shown.
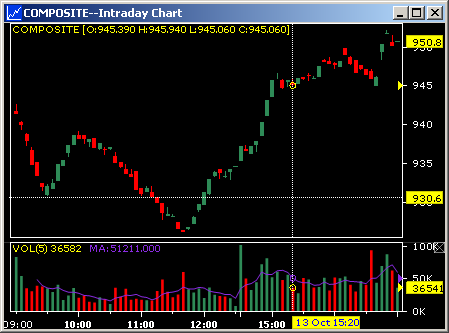
The Mini KLCI Chart  located
at the right gives the user an indication of the
Intraday market trend. Clicking on this chart opens a bigger view of the KLCI as shown below.
located
at the right gives the user an indication of the
Intraday market trend. Clicking on this chart opens a bigger view of the KLCI as shown below.