|
TA Marker Scanner
|
Previous Top Next |
|
Category
|
Filters
|
Scan criteria
|
|
Price
|
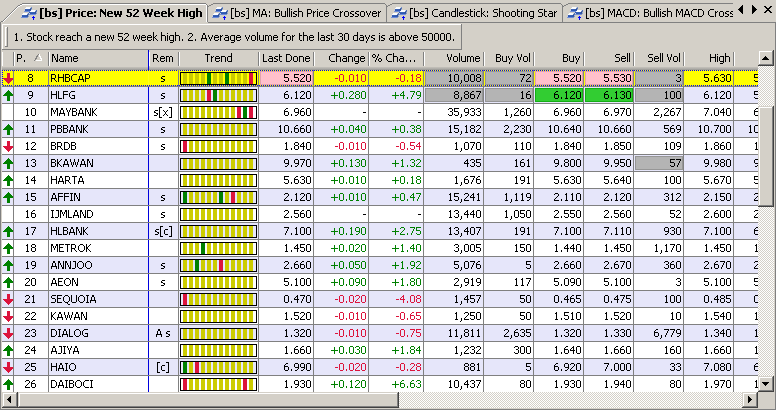
New 52 Week High
|
Stock reach a new 52 week high.
Average volume for the last 30 days is above 50000.
|
|
New 52 Week Low
|
Stock reach a new 52 week low.
Average volume for the last 30 days is above 50000.
| |
|
Consecutive Days Gains
|
Closing price has been increasing over the last 5 days.
Average Volume is above 100,000.
| |
|
Consecutive Days Loss
|
Closing price has been decreasing over the last 5 days.
Average Volume is above 100,000.
| |
|
Moving Average (MA)
|
Bullish Price Crossover
|
Closing price crossed above MA(40) within the last 1 day.
Previous day closing price is below the MA(10) for the last 5 days.
|
|
Bearish Price Crossover
|
Closing price crossed below MA(40) within the last 1 day.
Previous day closing price is above the MA(10) for the last 5 days.
| |
|
Short Term Bullish MA Crossover
|
MA(10) crossed above MA(15) within the last 1 day.
| |
|
Short Term Bearish MA Crossover
|
MA(10) crossed below MA(15) within the last 1 day.
| |
|
Medium Term Bullish MA Crossover
|
MA(25) crossed above MA(50) within the last 1 day.
| |
|
Medium Term Bearish MA Crossover
|
MA(25) crossed below MA(50) within the last 1 day.
| |
|
Long Term Bullish MA Crossover
|
MA(50) crossed above MA(200) within the last 1 day.
| |
|
Long Term Bearish MA Crossover
|
MA(50) crossed below MA(200) within the last 1 day.
| |
|
MACD
|
Bullish MACD Crossover
|
Fast MACD(12,26) line crossed above the slow MACD(12,26) line.
MACD Histogram(12,26) is above 0.
|
|
Bearish MACD Crossover
|
Fast MACD(12,26) line crossed below the slow MACD(12,26) line.
MACD Histogram(12,26) is below 0.
| |
|
MACD Overbought
|
MACD Histogram(12,26,9) reached a new 6 month high.
MACD Histogram(12,26,9) has been above 0 for the last 3 weeks.
| |
|
MACD Oversold
|
MACD Histogram(12,26,9) reached a new 6 month low.
MACD Histogram(12,26,9) has been below 0 for the last 3 weeks.
| |
|
Bullish MACD Divergence
|
The closing price is decreasing for the last 3 days.
Fast MACD(12,26) is decreasing for the last 3 days.
| |
|
Bearish MACD Convergence
|
The closing price is increasing for the last 3 days.
Fast MACD(12,26) is increasing for the last 3 days.
| |
|
RSI
|
RSI Overbought
|
RSI(20) is above 80.
RSI(20) is increasing for the last 3 days.
Stock has more than 75 days of historical data.
|
|
RSI Oversold
|
RSI(20) is below 20.
RSI(20) is decreasing for the last 3 days.
Stock has more than 75 days of historical data.
| |
|
Short Term RSI Bullish Crossover
|
RSI(20) crossed above 50 within the last 1 day.
RSI(20) 1 day ago below 50 for the last 5 days.
| |
|
Short Term RSI Bearish Crossover
|
RSI(20) crossed below 50 within the last 1 day.
RSI(20) 1 day ago above 50 for the last 5 days.
| |
|
Bollinger Band
|
High Above Upper Bollinger Band
|
High above upper bollinger band(14).
|
|
Low Below Lower Bollinger Band
|
Low below lower bollinger band(14).
| |
|
Bullish Lower Bollinger Band Support
|
Low 1 day ago below lower bollinger band(20) and close above close 1
day ago.
| |
|
Bearish Upper Bollinger Band
Resistance
|
High 1 day ago above upper bollinger band(20) and close below close 1
day ago.
| |
|
Accumulation
Distribution
|
Bullish Accumulation Distribution
|
Accumulation distribution increasing for the last 7 days.
|
|
Bearish Accumulation Distribution
|
Accumulation distribution decreasing for the last 7 days.
| |
|
CCI
|
Bullish CCI Oversold And Reversing
|
CCI(26) below -100 and CCI(26) 1 day ago decreasing for the last 3 days.
CCI(26) above CCI(26) 1 day ago.
|
|
Bearish CCI Overbought And Reversing
|
CCI(26) above 100 and CCI(26) 1 day ago increasing for the last 3 days.
CCI(26) below CCI(26) 1 day ago.
| |
|
Parabolic SAR
|
Bullish Parabolic SAR Reversal
|
Parabolic SAR 1 day ago above close 1 day ago for the last 5 days.
Parabolic SAR below close.
|
|
Bearish Parabolic SAR Reversal
|
Parabolic SAR 1 day ago below close 1 day ago for the last 5 days.
Parabolic SAR above close.
| |
|
Volume
|
Volume Spike
|
Volume is more than 500% above average volume(10) 1 day ago
Volume > 200000 and close > 0.10
|
|
Consecutive Days Of Increasing
Average Volume
|
Average Volume(20) has been increasing over the last 2 week.
Average Volume(20) is above 100000.
| |
|
Consecutive Days Of Decreasing
Average Volume
|
Average Volume(20) has been decreasing over the last 2 week.
Average Volume(20) is above 50000.
| |
|
Stochastic
|
Fast Stochastic Sell Signal
|
Fast Stochastic(15,5) Fast %K crossed below 80.
Fast Stochastic(15,5) Fast %K 1 day ago was above 80 for the last 5 days.
Average volume(30) is above 50000.
|
|
Fast Stochastic Buy Signal
|
Fast Stochastic(15,5) Fast %K crossed above 20.
Fast Stochastic(15,5) Fast %K 1 day ago was below 20 for the last 5 days.
Average volume(30) is above 50000.
| |
|
Directional Movement
(DM)
|
Bullish Directional Movement
|
-DI(14) crossed below +DI(14).
|
|
Bearish Directional Movemen
|
-DI(14) crossed above +DI(14).
| |
|
On Balance Volume
(OBV)
|
Bullish On Balance Volume
|
OBV increasing for the last 13 days.
|
|
Bearish On Balance Volume
|
OBV decreasing for the last 13 days.
| |
|
Williams %R
|
Bullish Williams %R
|
Williams %R(26) between -80 and -100.
|
|
Bearish Williams %R
|
Williams %R(26) between 0 and -20.
| |
|
Donchian Channels
|
High Above Upper Donchian Channels
|
High crossed above the upper Donchian Channel(14,4)
|
|
Chaikins Volatility
|
Increasing Chaikins Volatility
|
Chaikins Volatility(10,10) has been increasing for 5 days.
|
|
Decreasing Chaikins Volatility
|
Chaikins Volatility(10,10) has been decreasing for 5 days.
| |
|
Historical Volatility
|
Increasing Historical Volatility
|
Historical Volatility(100,1) increasing for the last 10 days.
|
|
Decreasing Historical Volatility
|
Historical Volatility(100,1) decreasing for the last 10 days.
| |
|
Candlestick
|
Hanging Man
|
|
|
Bullish Abandoned Baby
|
| |
|
Bearish Abandoned Baby
|
| |
|
Bullish Engulfing
|
| |
|
Bearish Engulfing
|
| |
|
Bullish Harami Cross
|
| |
|
Bearish Harami Cross
|
| |
|
Bullish Kicking
|
| |
|
Bearish Kicking
|
| |
|
Morning Doji Start
|
| |
|
Evening Doji Star
|
| |
|
3 Black Crows
|
| |
|
3 White Soldiers
|
| |
|
Inverted Hammer
|
| |
|
Dark Cloud Cover
|
| |
|
Piercing
|
| |
|
Shooting Star
|
|