|
Financials (Optional)
|
Previous Top Next |
|
Note:
|
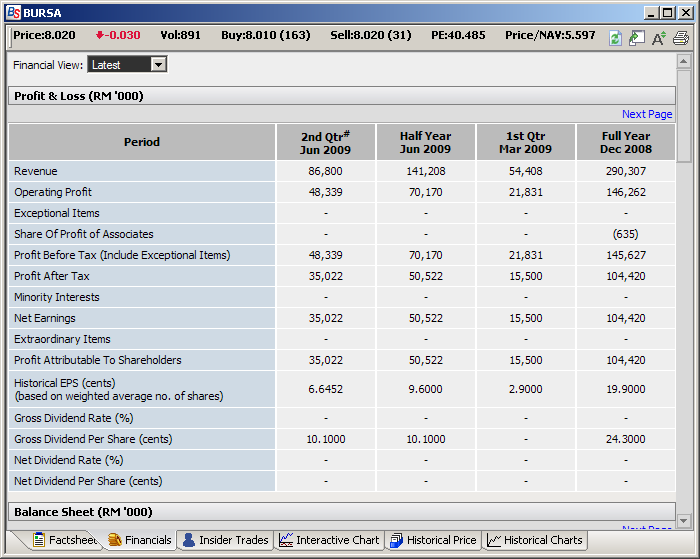
The Financial pages are updated within 2 business days upon official announcements.
|
|
Adjusted EPS
|
EPS is defined as Earnings Per Share. It shows the profitability of a company and is one of the
most popular financial ratios. EPS in ShareInvestor is adjusted for the current number of shares.
|
|
NAV
|
Shareholders’ Equity per share.
|
|
Net Earning
Margin
|
Net Earning Margin is the Net Earnings divided by revenue.
|
|
Revenue Growth
|
Revenue Growth equals to Current Year Revenue minus Last Year Revenue and divided by Last
Year Revenue.
|
|
Net Earning
Growth
|
Net Earning Growth equals to Current Year Profit minus Last Year Profit and divided by Last
Year Profit.
|
|
Return on Asset
|
This ratio is considered a measure of how effectively assets are used to generate a return.
Return on Asset shows the amount of income for every dollar tied up in assets.
|
|
Return on Equity
|
Determine the rate of return for your investment in the business. This is one of the most
important ratios as it shows the hard facts about the business -- are you making enough of a
profit to compensate you for the risk of being in business? This ratio is often compared against
the ratio of other companies in the same or similar industry.
|
|
Current Ratio
|
This is the ratio between all the current assets and all the current liabilities. It is another way of
expressing liquidity. Current ratio of 1 means the company has $1.00 in current assets to cover
$1.00 in current liabilities. The higher the current ratio, the better.
|
|
Debt to Equity
|
A measure of a company's financial leverage calculated by dividing its total liabilities by
stockholders' equity. It indicates what proportion of equity and debt the company is using to
finance its assets. A high debt/equity ratio generally means that a company has been aggressive
in financing its growth with debt. This can result in volatile earnings as a result of the additional
interest expense
|
|
Hint:
|
To change the font size, click on the
 icon
in the top right hand corner. icon
in the top right hand corner. |