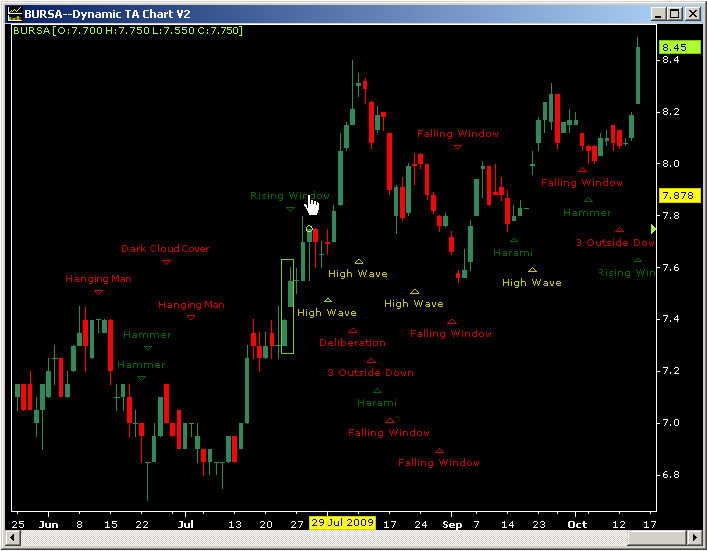
Candlestick patterns recognition is the latest added feature to the Dynamic TA Chart (Version 2).
With this recognition tool, investors can quickly identify different types of price action that will
result in reversal or continuation in trend. In addition, when combined with other technical
analysis indicators, this tool can be a very useful way to select entry and exit points.
To enable the Candlestick Patterns:
OR
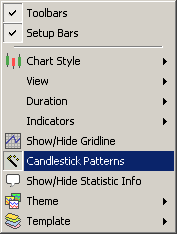
Right click on the chart and select Candlestick Patterns.
To configure the Candlestick Patterns:
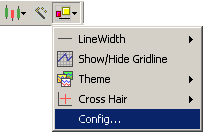
1. Click  and select Config... as shown below.
OR
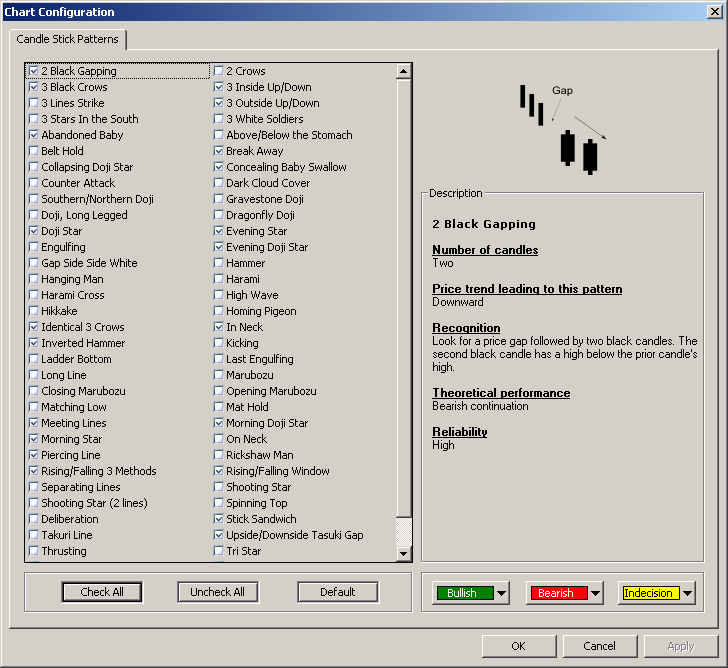
Click a pattern shown on the chart
2. A pop-up dialog will be seen as shown below. A write-up on each pattern is given when it is
selected.
See Also: