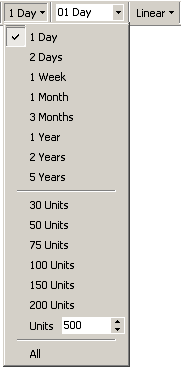
This option allows the user to define the quantity of data to be displayed each time a new counter
is charted. Note that the time to display a new counter depends on the quantity of data used.
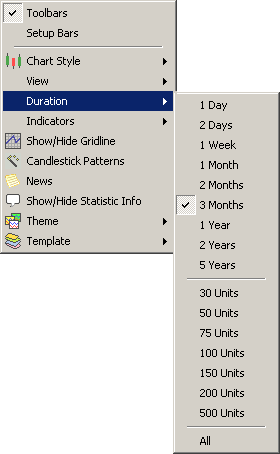
To set the Duration:
OR
Right click on the chart and select Duration.
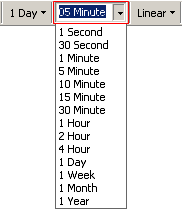
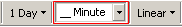
Setting the View
This option allows the user to display the chart to a desired time scale.
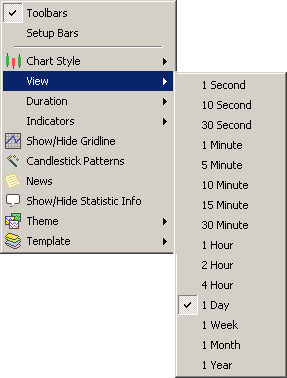
To set the View:
OR
Right click on the chart and select View.
Customizing the View:
The View can be further customize to any time frame.
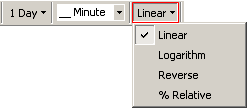
This option allows the user to choose the type of scale (linear scale, logarithm scale, etc.) for the
chart axis
To set the Scale Type:
See Also: