|
Indicators
|
Previous Top Next |
|
Group
|
Formula Full Name
|
Formula Code
|
|
Native
|
Exponential Moving Average
|
EMA
|
|
Double Exponential Moving Average
|
DEMA
| |
|
Hull Moving Average
|
HMA
| |
|
Open Interest
|
OpenInterest
| |
|
Previous Close
|
PreviousClose
| |
|
Simple Moving Average
|
MA
| |
|
Volume
|
VOL
| |
|
Volume On Price
|
VOP
| |
|
Weighted Moving Average
|
WMA
| |
|
Wilder Moving Average
|
WilderMA
| |
|
Trend Indicators
|
Advance Decline of Price
|
AdvanceDecline
|
|
Aroon
|
Aroon
| |
|
Balance of Maket Power
|
BMP
| |
|
Bullish-Bearish Indicator
|
BBI
| |
|
Choppiness Index
|
Choppiness
| |
|
Daily Moving Average
|
DailyMA
| |
|
Directional Divergence Index
|
DDI
| |
|
DMI / ADX / ADXR
|
DMI
| |
|
Guppy Multiple Moving Average
|
GMMA
| |
|
Ichimoku Kinko Hyo
|
Ichimoku
| |
|
Moving Average Convergence Divergence
|
MACD
| |
|
Parabolic Stop and Reversal
|
SAR
| |
|
Pivot Lines
|
Pivot
| |
|
Price Action Indicator
|
PAIN
| |
|
Trendscore
|
Trendscore
| |
|
Triple-Smoothed Moving Average
|
TRIX
| |
|
Variable Index Dynamic Average
|
VIDYA
| |
|
Vertical Horizontal Filter
|
VHF
| |
|
Volume Moving Average Convergence Divergence
|
VMACD
| |
|
Zig Zag
|
ZIG
| |
|
Momentum Indicators
|
Bias
|
BIAS
|
|
Bias Convergence Divergence
|
DBCD
| |
|
Bias3-Bias6 and Bias6-Bias12
|
B3612
| |
|
Commodity Channel Index
|
CCI
| |
|
Coppock Curve
|
Coppock
| |
|
Detrended Price Oscillator
|
DPO
| |
|
Ease of Movement
|
EOM
| |
|
Fast Stochastic
|
FastSO
| |
|
Momentum
|
MTM
| |
|
Money Flow Index
|
MFI
| |
|
Price Rate-Of-Change
|
ROC
| |
|
QStick
|
QStick
| |
|
Relative Momentum Index
|
RMI
| |
|
Relative Strength Index
|
RSI
| |
|
Slow Stochastic
|
SlowSO
| |
|
SRDM
|
SRDM
| |
|
Stochastic Oscillator
|
SO
| |
|
Stochastic Relative Strength Index
|
StochRSI
| |
|
Swing Index
|
SI
| |
|
Volume Rate-Of-Change
|
VROC
| |
|
Volume Relative Strength Index
|
VRSI
| |
|
Williams %R
|
WR
| |
|
Volatility Indicators
|
Average True Range
|
ATR
|
|
Chaikin Volatility
|
CKV
| |
|
Change
|
Change
| |
|
DeMarker
|
DeMarker
| |
|
DeMarker Range Expansion Index
|
TDREI
| |
|
Historic Volatility
|
HV
| |
|
Mass Index
|
MASS
| |
|
Psychological Line
|
PSY
| |
|
R-Squared
|
RSquared
| |
|
Standard Deviation
|
STD
| |
|
Volatility Ratio
|
VR
| |
|
Price Volume Indicators
|
Accumulation Swing Index
|
ASI
|
|
Demand Index
|
Demand
| |
|
Force Index
|
Force
| |
|
Market Facilitation Index
|
BWMFI
| |
|
Negative Volume Index
|
NVI
| |
|
On Balance Volume
|
OBV
| |
|
Positive Volume Index
|
PVI
| |
|
Price and Volume Trend
|
PVT
| |
|
Standard On Balance Volume
|
SOBV
| |
|
William's Variable Accumulation Distribution
|
WVAD
| |
|
Bands Indicators
|
Average True Range Bands
|
ATRBands
|
|
Bollinger Bands
|
BBand
| |
|
Bollinger Band Width
|
BBWidth
| |
|
Bollinger Band Percent
|
BBPercent
| |
|
Bullish-Bear Bollinger
|
BBIBOLL
| |
|
CDP
|
CDP
| |
|
Donchian Channels
|
DonchianChannel
| |
|
Ehlers Filters
|
EF
| |
|
Envelopes / Trading Bands
|
ENV
| |
|
Keltner Channel
|
Keltner
| |
|
MIKE
|
MIKE
| |
|
Elder Safe Zone
|
SafeZone
| |
|
Standard Deviation Bands
|
STDBands
| |
|
Stoller Average Range
|
STARC
| |
|
Volume Indicators
|
Chaikin Volume Accumulation
|
CVA
|
|
Daily Volume Indicator
|
DVI
| |
|
N day's Maximum Volume
|
MaxV
| |
|
Percentage Volume Oscillator
|
PVO
| |
|
Volume Oscillator
|
VOSC
| |
|
Volume STD
|
VSTD
| |
|
Volume Weighted Average Price
|
VWAP
| |
|
Oscillator Indicators
|
Accumulation / Distribution
|
AD
|
|
Aroon Oscillator
|
AroonOsc
| |
|
Body Momentum
|
BM
| |
|
Chaikin Money Flow
|
CMF
| |
|
Chaikin Oscillator
|
CKO
| |
|
Chande Momentum Oscillator
|
CMO
| |
|
Elder Ray Oscillator
|
ElderRay
| |
|
Momentum Indicator Convergence Divergence
|
MICD
| |
|
Percentage Price Oscillator
|
PPO
| |
|
Price Oscillator
|
POSC
| |
|
Rate of Change Convergence Divergence
|
RCCD
| |
|
Relative Vigor Index
|
RVI
| |
|
SRMI
|
SRMI
| |
|
Stochastic Momentum Index
|
SMI
| |
|
Ultimate Oscillator
|
ULT
|
 |
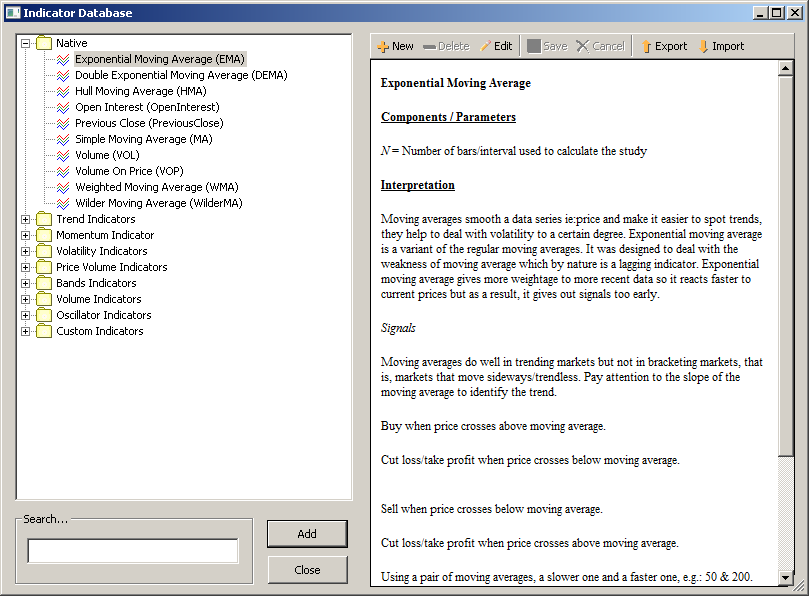
Adding Indicator
2. Click
 to add new indicators to add new indicators3. Select the indicator to add from the Indicator Database.
4. Click Add from the pop-up dialog (See above) or double clicked on the selected
indicator.
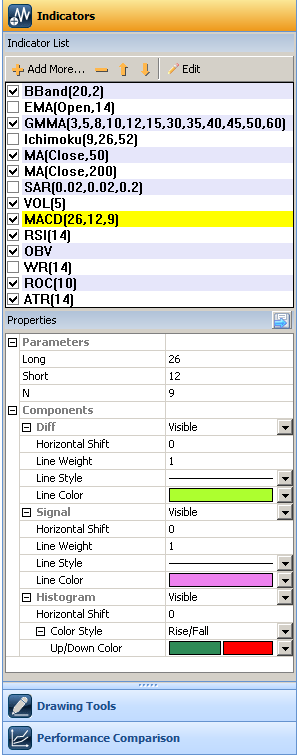
5. The added indicator will be added as shown in the Indicator List.
Deleting Indicator
2. Select the indicator to be removed.
3. Click
 to remove the indicator. to remove the indicator.Show/Hide Indicator
2. Check/Uncheck the checkbox to show/hide the indicator.
Shifting Indicators' Panel Position
2. Select the indicator to be shifted. (Only indicators added as separate panel can be
shifted.)
3. Click
  to shift the indicator position up or down. to shift the indicator position up or down.Editing Indicator
2. Select the indicator to be edited. (Only active indicator can be edited.)
Changing Indicator's properties
2. Select the indicator to change its properties. (Only active indicator can be edited.)
3. The properties of the selected indicator are shown under the Properties headings.
Save Default Indicator's Properties
2. After editing the indicator's properties, click
 to save. to save. |
