Opening the Historical Charts
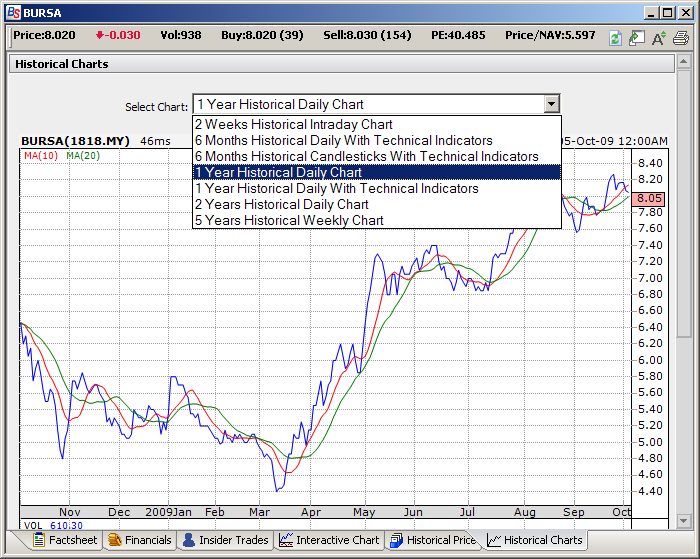
Selecting different type of historical charts
• 2 Weeks Historical Intraday Chart
• 6 Months Historical Daily With Technical Indicators
• 6 Months Historical Candlesticks With Technical Indicators
• 1 Year Historical Daily Chart
• 1 Year Historical Daily With Technical Indicators
• 2 Years Historical Daily Chart
Technical indicators
The technical indicators displayed are:
• ROC (25)
• On Balance Volume
|
Hint:
|
To change the font size, click on the  icon in the top right hand corner.
|