Opening the 
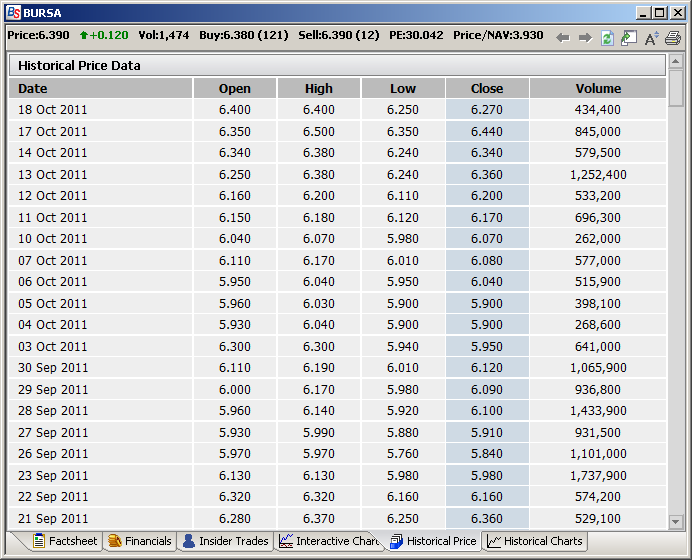
Historical Price Data
Explanation
The Historical Price shows the share prices for the counter in the past twelve months. The
Open, High, Low and closing share prices and total volume is displayed for each trading day.
A quick glance through this table will give you a good idea of the trading pattern of the counter
over the past year.
Note:
|
The historical price data is adjusted for any bonus issue, stocks split, etc.
|
Hint:
|
To change the font size, click on the
icon in the top right hand corner.
|