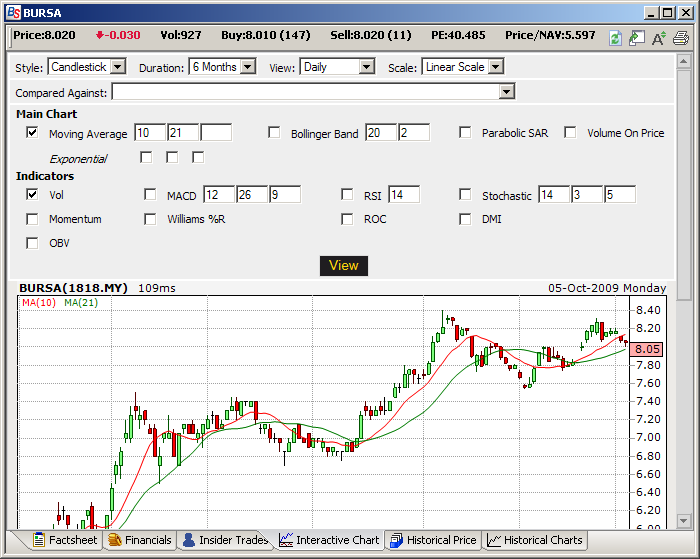
The Interactive Chart is a charting application which takes in live market feeds and plots these
with a selection of technical indicators. It also supports the comparison of the current selected
counter to another counter for analysis.
Opening the Interactive Chart
Using the Interactive Chart
1. Select the type of view (Duration, View, Scale)
2. Check the preferred indicators and edit their parameters (if any)
3. Click on View to plot the chart.
Comparing Current Counter against another Counter
1. Select the counter to compare with the current counter.
2. Click on View to plot the chart.