Opening the Time & Sales
OR
OR
Select the preferred counter and press F5 from your keyboard.
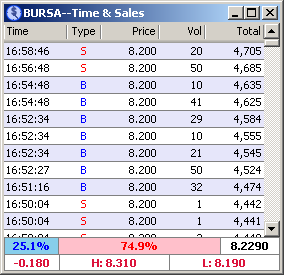
Explanation
1. The Time & Sales shows all the trades done for a particular counter with the time
stamp
for each transaction.
2. This feature breaks down all the trades done into individual transactions. It shows the
number of lots done and the total volume of transactions. The user is able to see all
transactions from the beginning until the end of the trading day.
3. Each transaction is categorized as:
• Buy Up (B)
• Sell Down (S)
• Mid transaction (M)
• An Unknown transaction (UN)
• Strategy Leg for Derivative (SL)
• Trade Cancellation (TC)
|
Note:
|
A buy up occurs when the shares are bought from the sell queue.
A sell down occurs when shares are sold into the buy queue.
Mid transactions are married deals arranged between buyer and seller by a broker.
|
4. Any trade that occurs at a higher price than the previous will be highlighted in green whilst
those transacted at a lower prices than the previous transaction will be highlighted in red.
Trades done with values larger than $150K (per transaction) will be highlighted in grey.
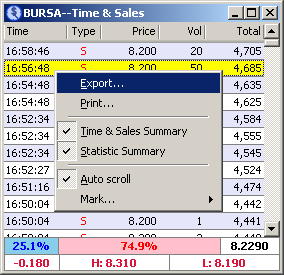
Right click as shown below:
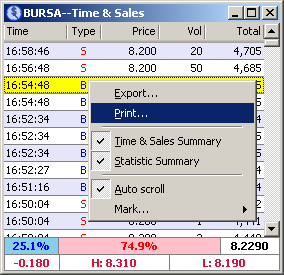
Printing Time & Sales
Right click as shown below:
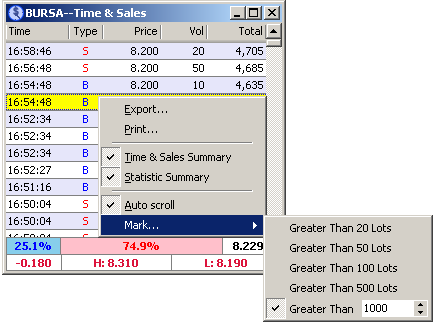
Marking Significant Trades
Right click as shown below:
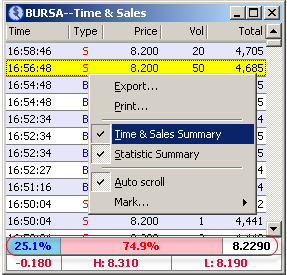
Time & Sales Summary
The Summary bar shows the percentage of Buy-Up to Sell-Down and the Volume Weighted
Average Price. To show this summary bar, right click as shown below:
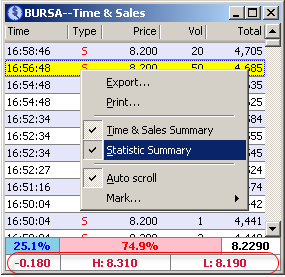
Statistic Summary
The Statistic Summary bar shows the Change, High and Low price of the day.
See Also: