|
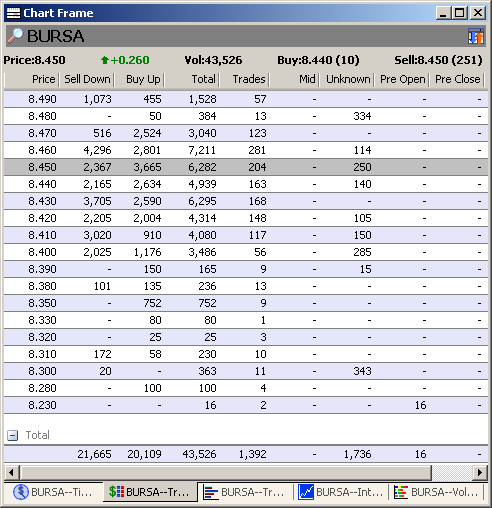
Trade Summary Matrix
|
Previous Top Next |
|
Price
|
Done Price
|
|
BU
|
Number of shares transacted from the sell queue
|
|
SD
|
Number of shares transacted from the buy queue
|
|
Trades
|
Total number of shares transacted
|
|
Mid
|
Number of shares transacted in a married deal
|
|
Unknown
|
Number of shares transacted that cannot be categorized as BU, SD or Mid.
|
 at the bottom
tab.
at the bottom
tab.