|
Trade Summary Matrix [10 Days]
|
Previous Top Next |
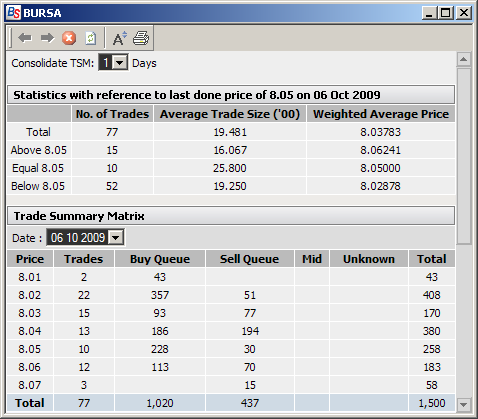
1. The Trade Summary Matrix [10 days] allows you to view Trade Summary Matrix data for the last 10 trading days. Click on the drop down menu to select the trading day to view. The Trade Summary Matrix shows the prices at which the counter was transacted and whether the trade took place at the buy or the sell queue.
2. Additional statistics (E.g. average trade size and weight average price for the day) are also shown.
3. The trading data of a few days can also be consolidated for viewing in a single Trade
Summary Matrix table.