|
Volume Distribution Charts [10 Days]
|
Previous Top Next |
Opening the Volume Distribution Charts [10 days]
Right click on the preferred counter and select Volume Distribution Charts [10 days]. (See also Opening the Stock Database Menu)
OR
Select the preferred counter and press Ctrl+F8 from your keyboard.
Explanation
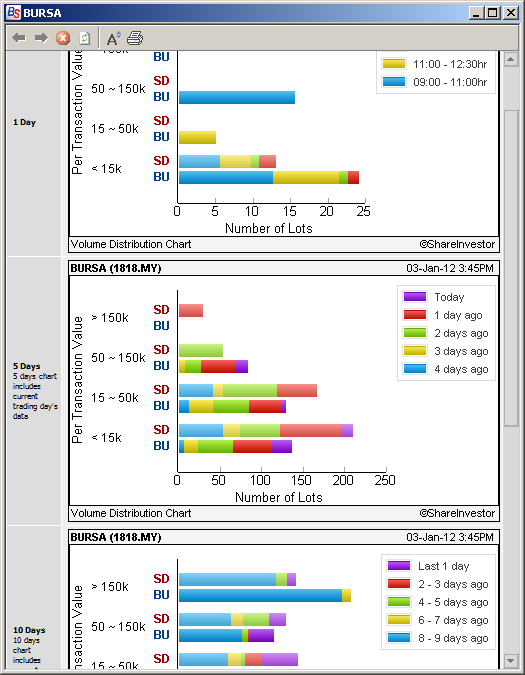
The Volume Distribution Charts [10 days] allows you to view volume distribution of the counter up to the last 10 trading days. From this page, you can view the Volume Distribution charts over a 1, 5 or 10 day period by scrolling downwards. 5 day and 10 day Volume Distribution charts are important as they can show what had been happening over the period of time in terms of total buy ups and sell downs.